Let's Go Learn Knowledge Base
Question
How do I run the Average Scores Report from the Data Portal - Teacher and Admin accounts
 
Answer

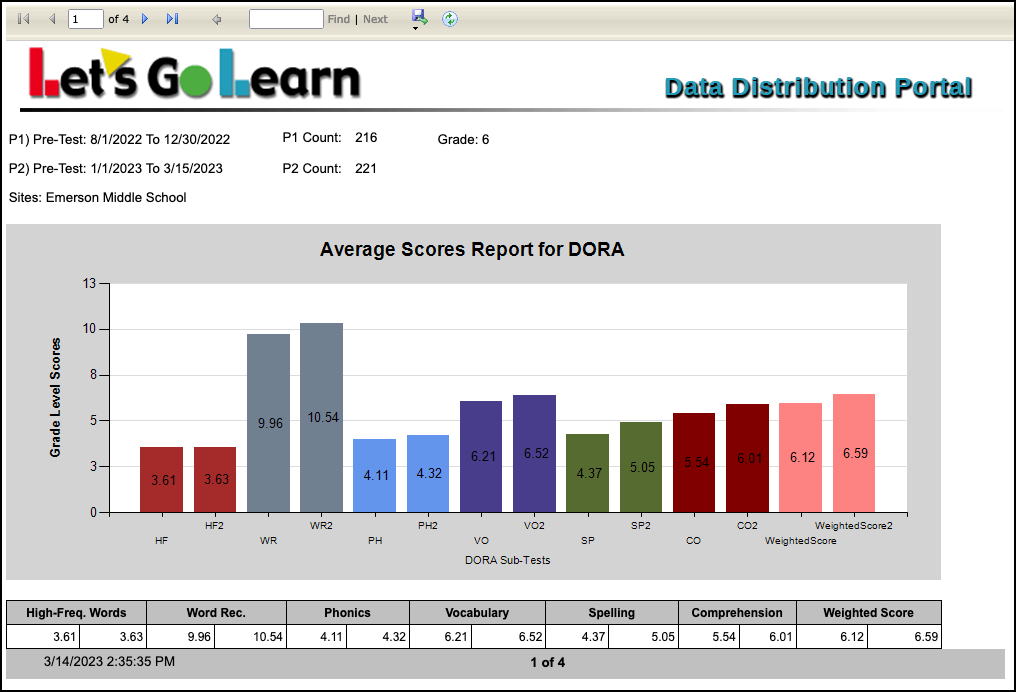
The Average Scores Report provides the average grade level scores with all strands comparing two time periods.

FROM ADMIN/PRINCIPAL ACCOUNT

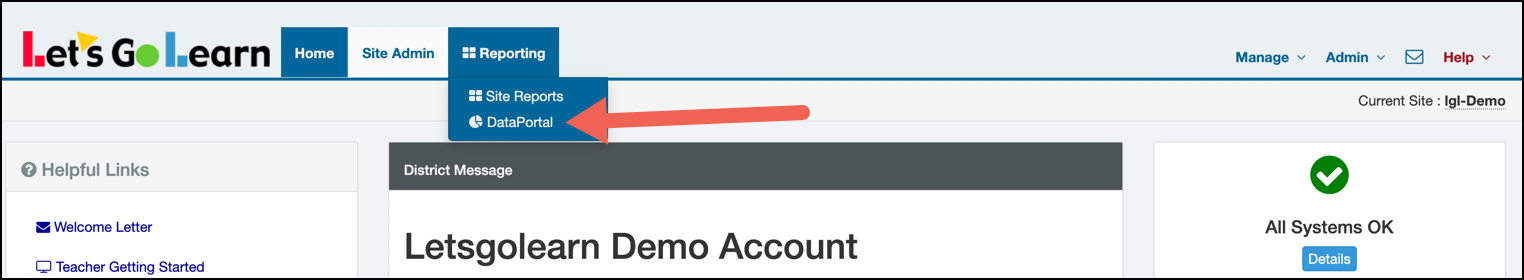
Log into your Admin account and click on the Reporting tab; then select DataPortal.

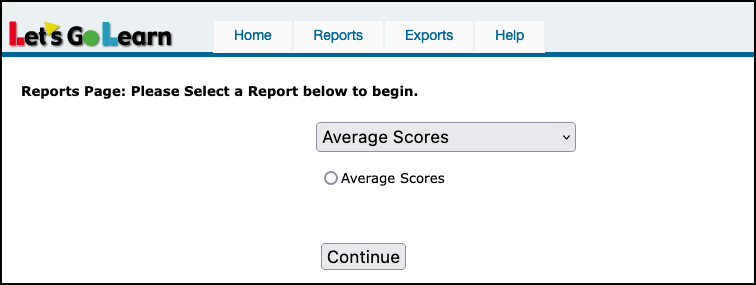
In the Data Portal, click on the Reports tab and select Average Scores.

Mark the cirlcle for Average Scores and click Continue.

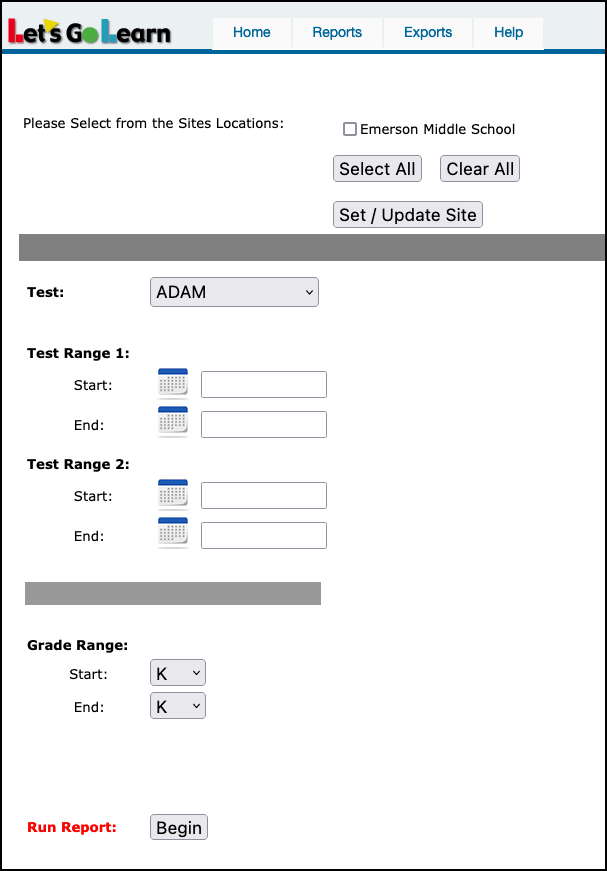
  • Select the site(s) and then click on Set/Update Site.
  • Select the test.
  • Input test range 1 & 2.
  • Select grade range for report.
  • Click Begin to run report.

Example report below.


FROM TEACHER ACCOUNT: 

STEP 1 - Log into the Data Portal from the teacher account by clicking on the Reporting tab and selecting DataPortal.  You can also access the Data Portal from the Scores & Reports tab.

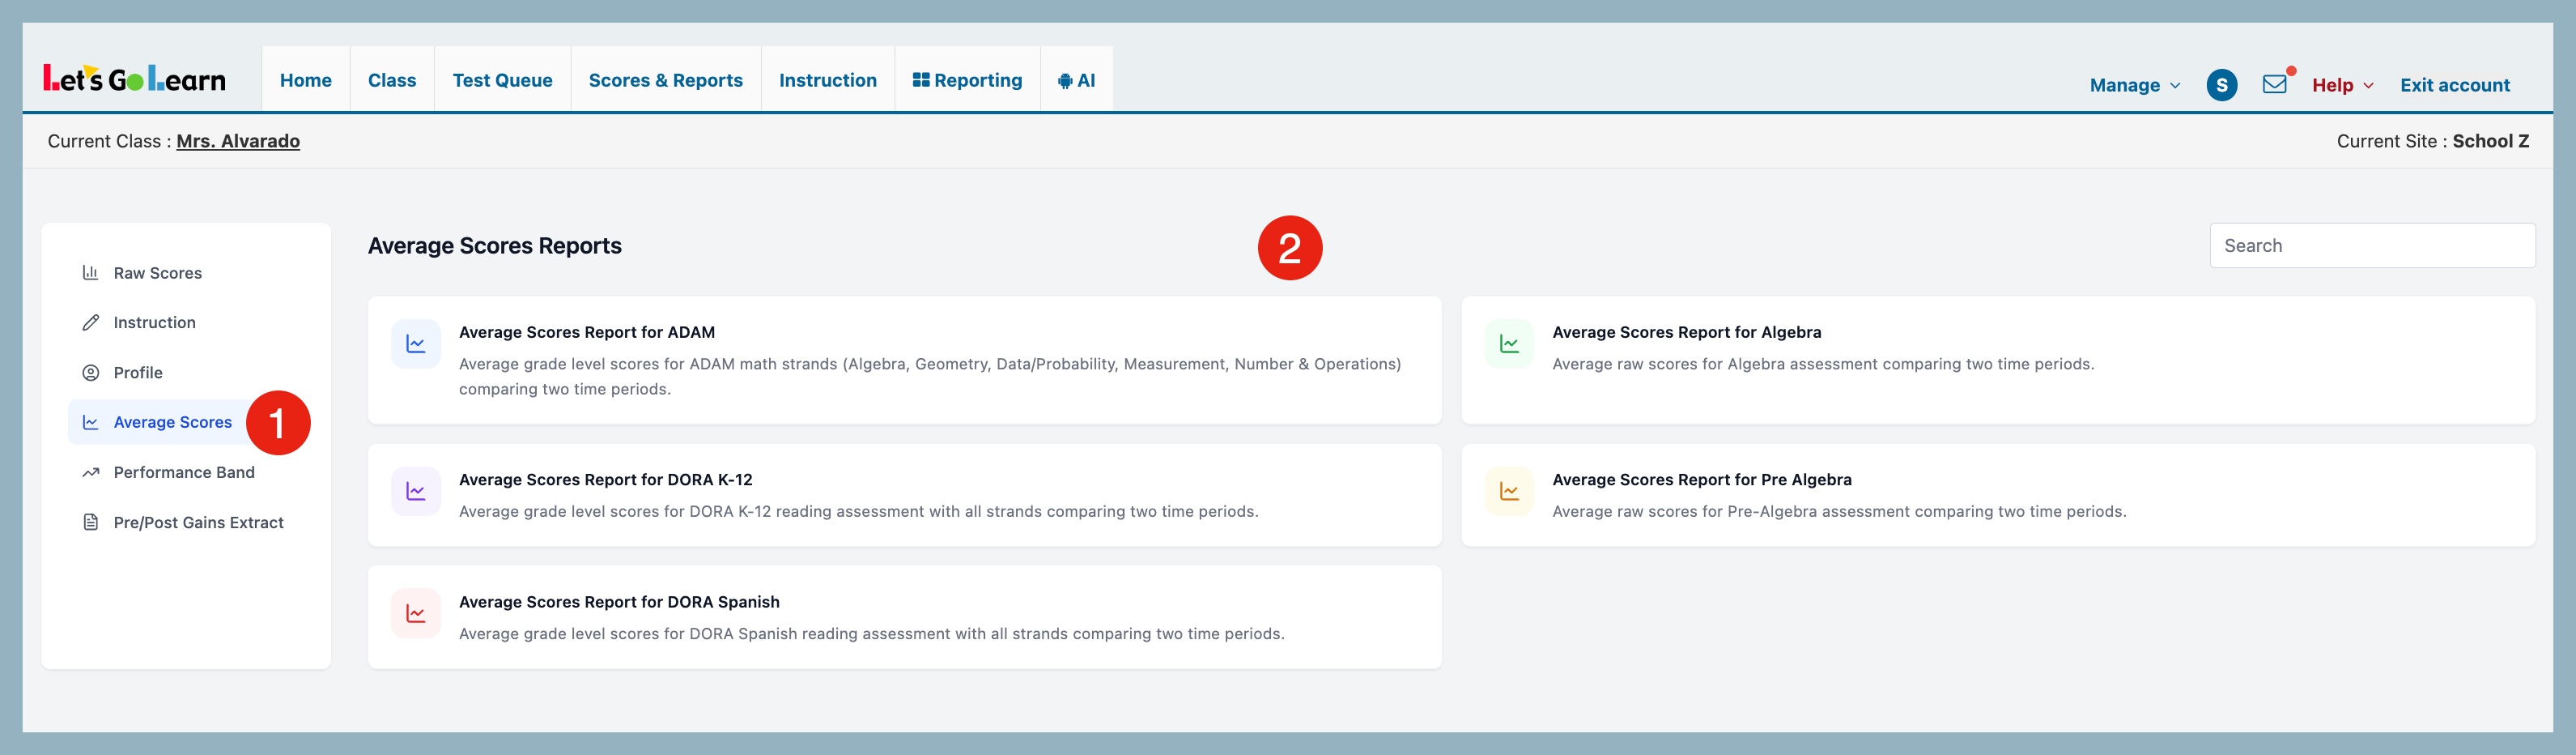
STEP 2 - On the Data Portal page, click on Average Scores and then select the report for the specific assessment you wish to view.

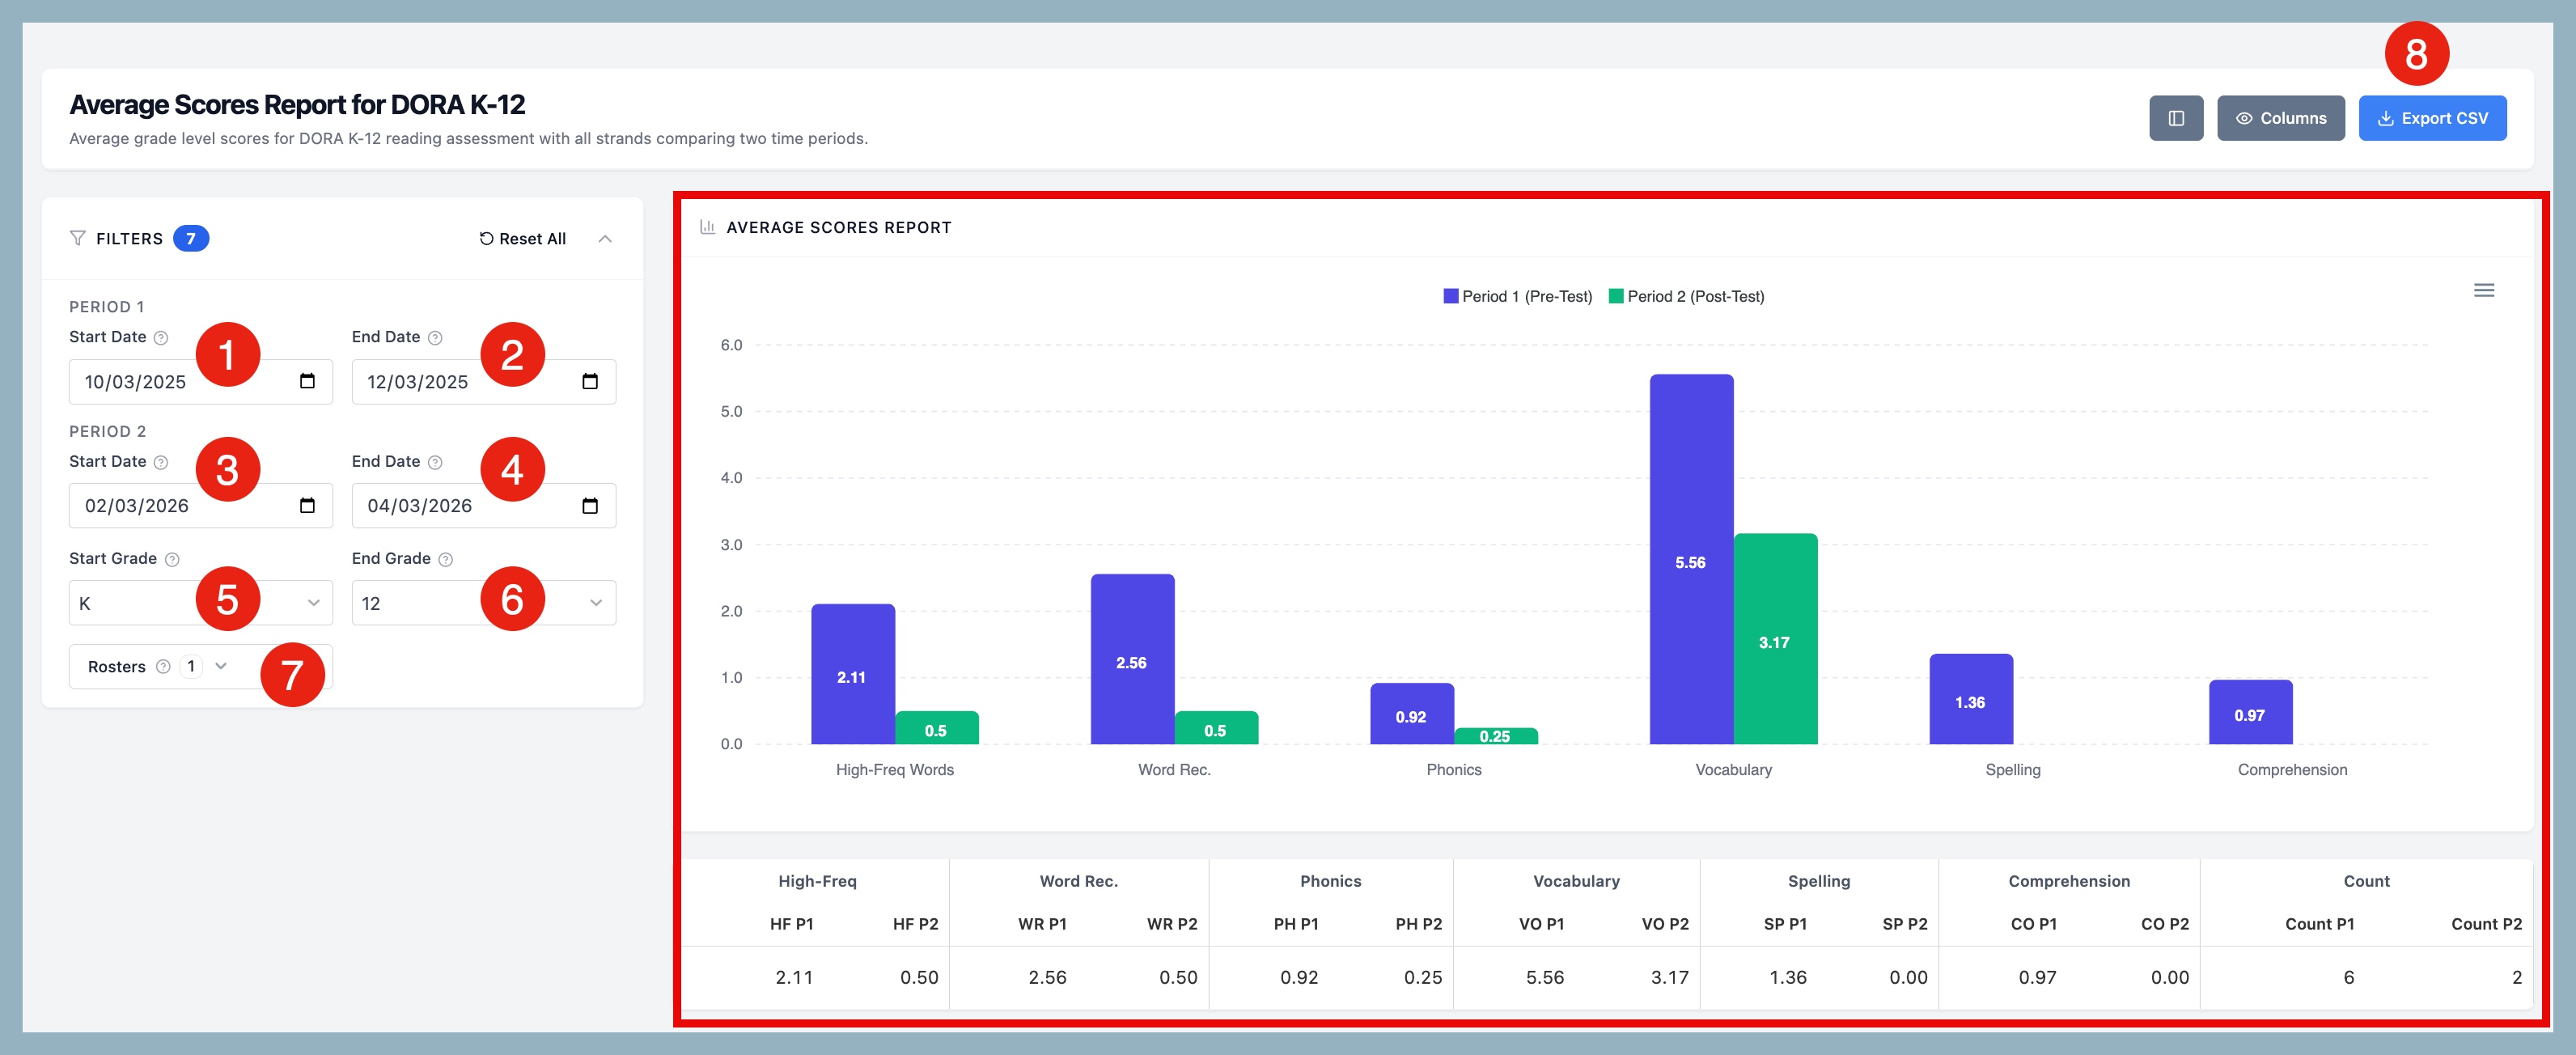
STEP 3 - On the Average Scores Report page, select your report criteria.

  1. Period 1 Start Date - select start date range
  2. Period 1 End Date - select end date range
  3. Period 2 Start Date - select start date range
  4. Period 2 End Date - select end date range
  5. Start Grade - select start grade range
  6. End Grade - select end grade range
  7. Rosters - select roster
  8. Export CSV - export your report to a CSV file

Once filters are applied, your report will appear on the right of the page.


Relevant Attachments
Was this Article Helpful?
Please add a quick rating! It will help us improve articles for you!
Show fields from Show fields from Show fields from a related table
Report Name *
Description
Reports and Charts Panel
Each table has a panel listing its reports and charts, organized in groups.
Please wait while your new report is saved...
Field label
Column heading override
Justification
What does auto mean?
Fields in:

Fields to Extract:

Name for the new table:
Items in the new table are called:

When you bring additional fields into a conversion, Quickbase often finds inconsistencies. For example, say you're converting your Companies column into its own table. One company, Acme Corporation, has offices in New York, Dallas and Portland. So, when you add the City column to the conversion, Quickbase finds three different locations for Acme. A single value in the column you're converting can only match one value in any additional field. Quickbase needs you to clean up the extra cities before it can create your new table. To do so, you have one of two choices:

  • If you want to create three separate Acme records (Acme-New York, Acme-Dallas and Acme-Portland) click the Conform link at the top of the column.
  • If the dissimilar entries are mistakes (say Acme only has one office in New York and the other locations are data-entry errors) go back into your table and correct the inconsistenciesin this case, changing all locations to New York. Then try the conversion again.

Read more about converting a column into a table.