Active Pulse Math - ADAM
Overview
The Active Pulse Math page is used to view assessments and reports for ADAM, ADAM Spanish, DOMA Pre-Algebra, and DOMA Algebra. From the Summary tab, you can view individual student results and class reports for ADAM and DOMA Pre-Algebra. If you are using Formative Assessments, keep in mind that those scores are also incorporated into the Active Pulse Math data that is seen on this page.
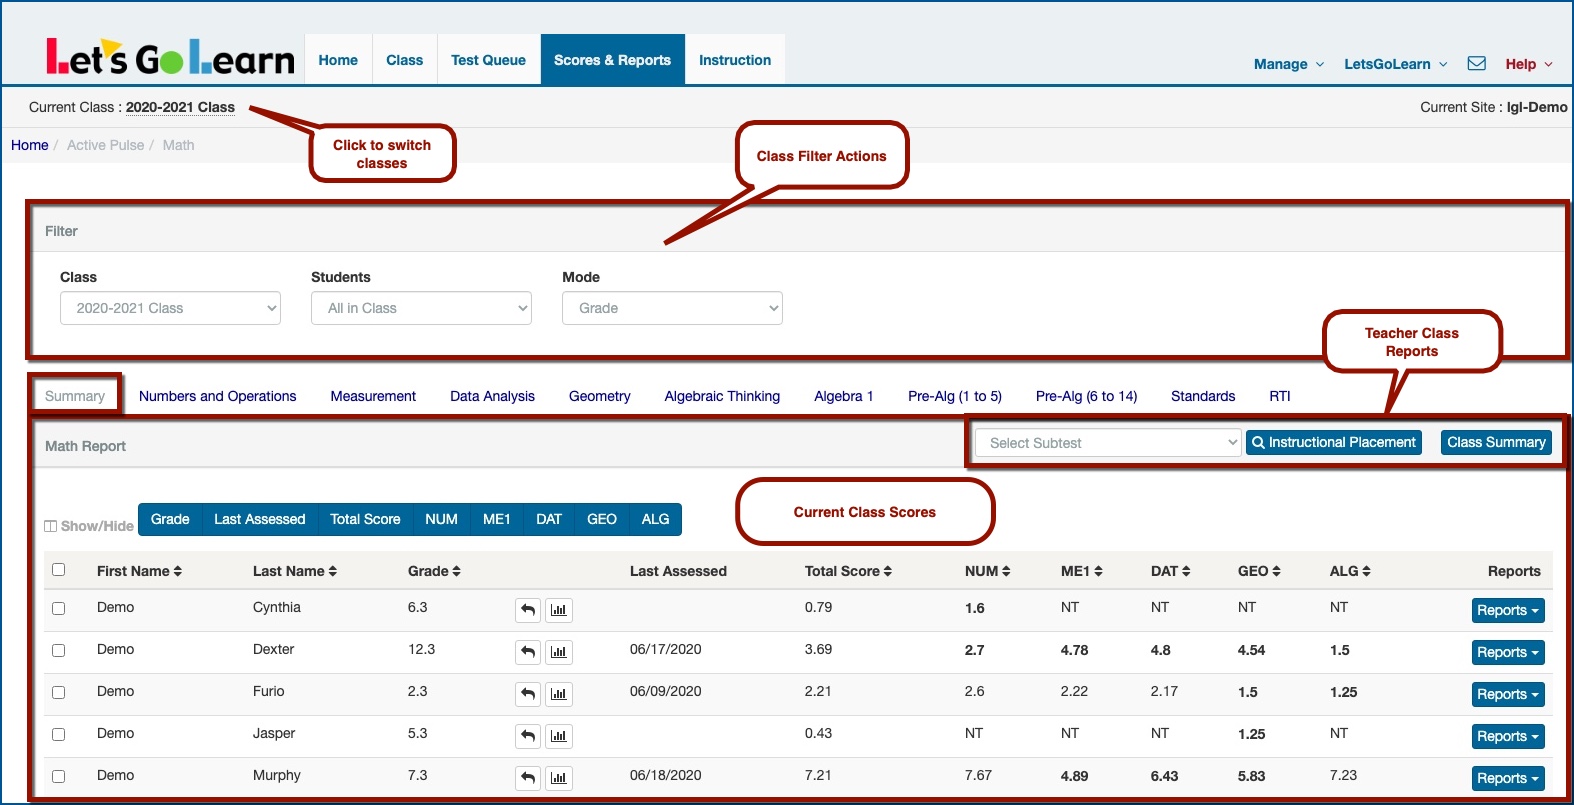
Class Filter Actions
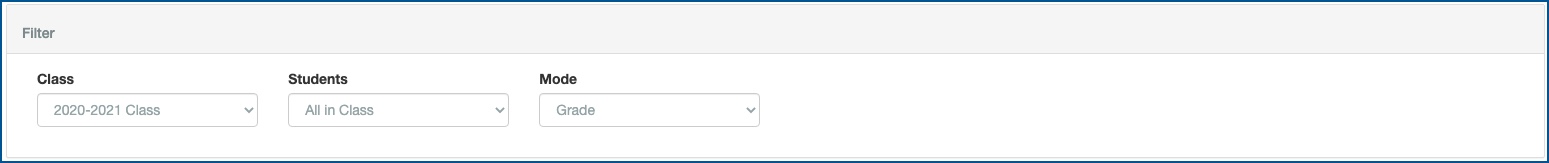
- Class - This filter allows you to switch among multiple classes.
- Students - This filter allows you to view "All in Class" or only students "With Assessments." The default view is "All in Class."
- Mode - This filter allows you to view the results in either Grade or Raw Scores mode.
Teacher Class Reports

*NOTE:
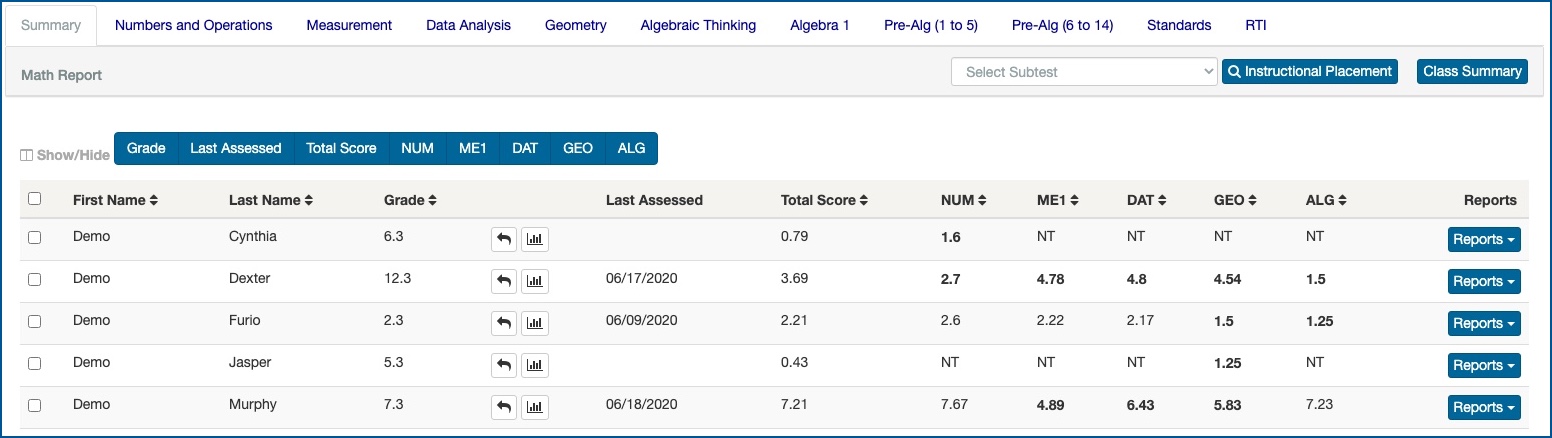
To view Strand Scores, click on the Numbers and Operations, Measurement, Data Analysis, Geometry, Algebraic Thinking tabs.
To view DOMA Pre-Algebra Scores, click on the Pre-Alg (1 to 5) and Pre-Alg (6 to 14) tabs.
To view Algebra 1 Scores, click on the Algebra 1 tab.
To view Class Standards Tool, click on the Standards tab.
To view the RTI Report, click on the RTI tab.
- Instructional Placement
- This report helps you group students according to the scope and sequence of teaching and learning every skill tested in ADAM. For more information - Click Here
- Class Summary
- This report allows you to download the individual ADAM Summary reports for all students in the current class in a PDF format (batch printing).
Current Class Scores
FOR VIDEO - Click Here
*NOTE: Scores are populated on this page while the student is taking the assessment. You may view Reports even while the student is still "in progress" with the test. Even though you see scores for a student on this page, this does not mean that the student has completed the assessment. If a student has completed the ADAM test, a date will appear for ADAM under the "Last Assessed" column. If you are unsure of whether the student has completed the assessment, use the Test Queue page to verify your student's progress.
- Show/Hide
- This function allows you to show or hide any column title to help you view your data.
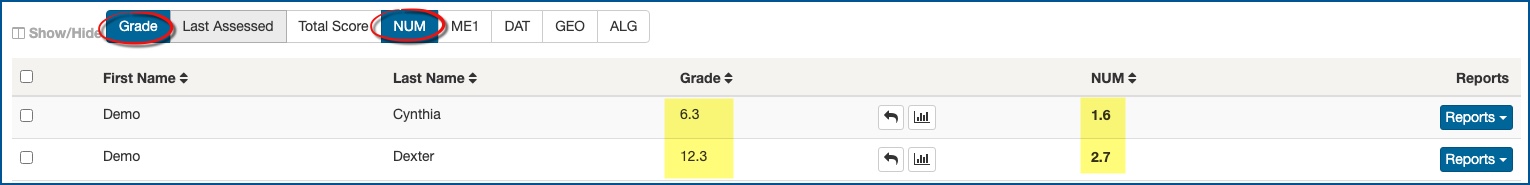
- Grade - This is the student's current grade level.
 - Test Log
- The Test Log is used to view previous student assessment results. For more information - Click Here.
 - Progress Monitor
- The Progress Monitor tool is used to view individual student gains. For more information - Click Here.
- Last Assessed
- This column will show you the last completed math assessment for this student by date. If you roll your mouse over the date, it will display the assessment name as well as other math assessments completed.
- Total Score
- The total score for the ADAM assessment is the weighted average of all the raw scores (skills) for the five strands of ADAM, which is then converted to a grade-level equivalency. For more information - Click Here.
- ADAM Score Grade range: 0.1 to 7.9
- NUM - Numbers and Operations
- ME1 - Measurement
- DAT - Data Analysis
- GEO - Geometry
- ALG - Algebraic Thinking
- Reports -
- Summary - One-page summary report
- Detail - This is a full detailed individual diagnostic report. It shows specific information about the specific skills each student is ready to work on next. For more information - Click Here. For Video - Click Here
- SPED - For more information - Click Here.
- Standards - These are standards reports. They include all states as well as some additional standards-based reports.
- Test Log
- This report allows you to view previous student assessments. For more information - Click Here.
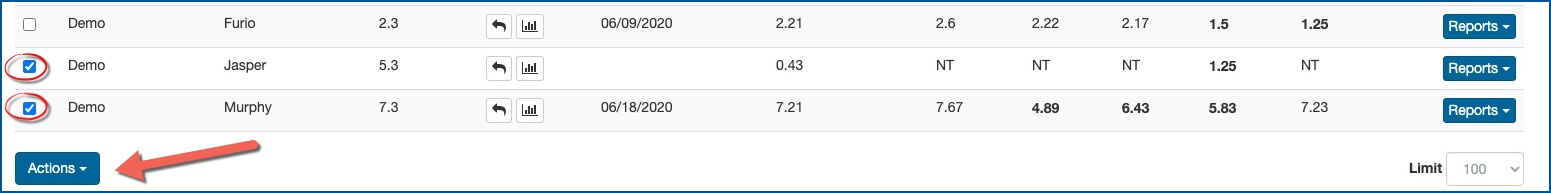
- Actions - This tool allows you to use the Assignments tool directly from the Active Pulse Math page. For more information - Click Here.
How to interpret the ADAM K-7 Detail report - Click Here


 Profile
 Sign up now
 Manage
  Sign out