Let's Go Learn Knowledge Base
Question
How to use the Demonstrated Gains Report to measure LGL Edge Gains
 
Answer

The Demonstrated Gains Report is designed to show student growth based on varying usage levels
of either LGL Math Edge or LGL ELA Edge. The idea is to sort students into varying groups
based on how much LGL Edge supplemental instruction they have completed.

Keep in mind that only students who complete a pre- and post-assessment in the date range will be
included in the report. Also, data may be skewed if there are multiple student groups
within the sample being examined.

To get Started - Log inot the Data Portal.

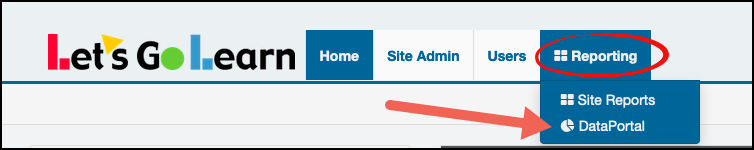
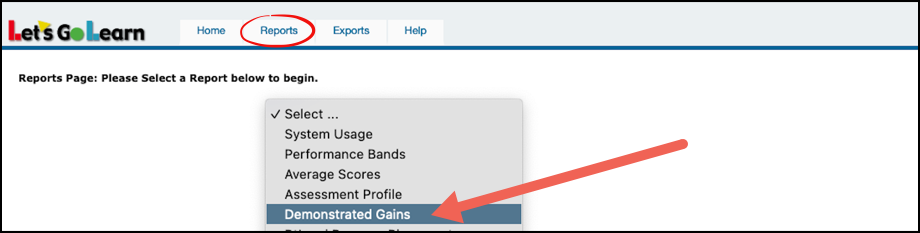
Step One:  Click on the Reports tab and select Demonstrated Gains.

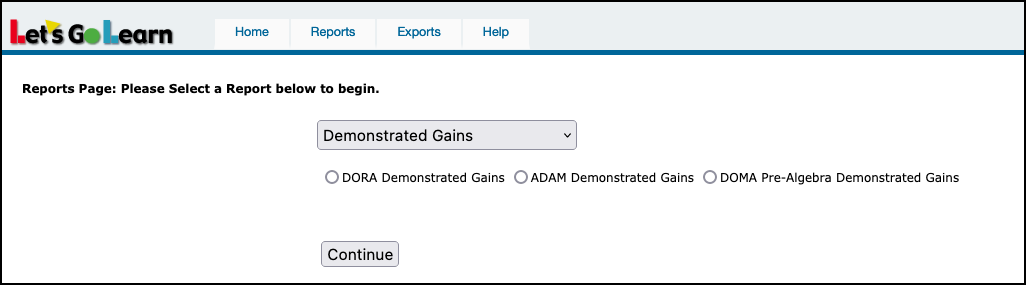
Step Two:  Choose your assessment.

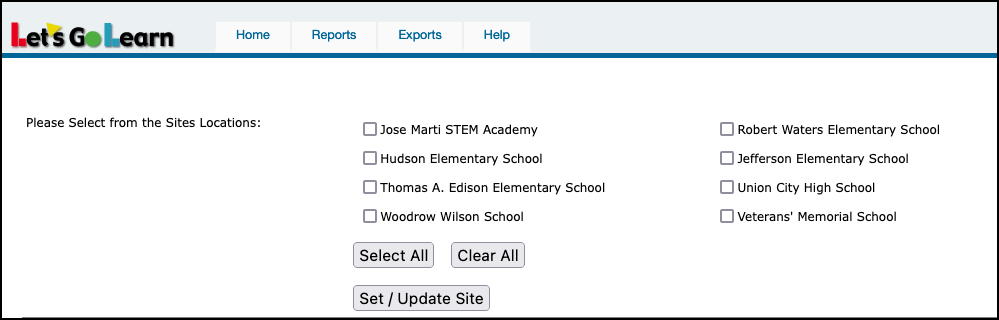
Step Three:  Choose your site.  Check the boxes next to the Sites Locations and then click on Set/Update Site.

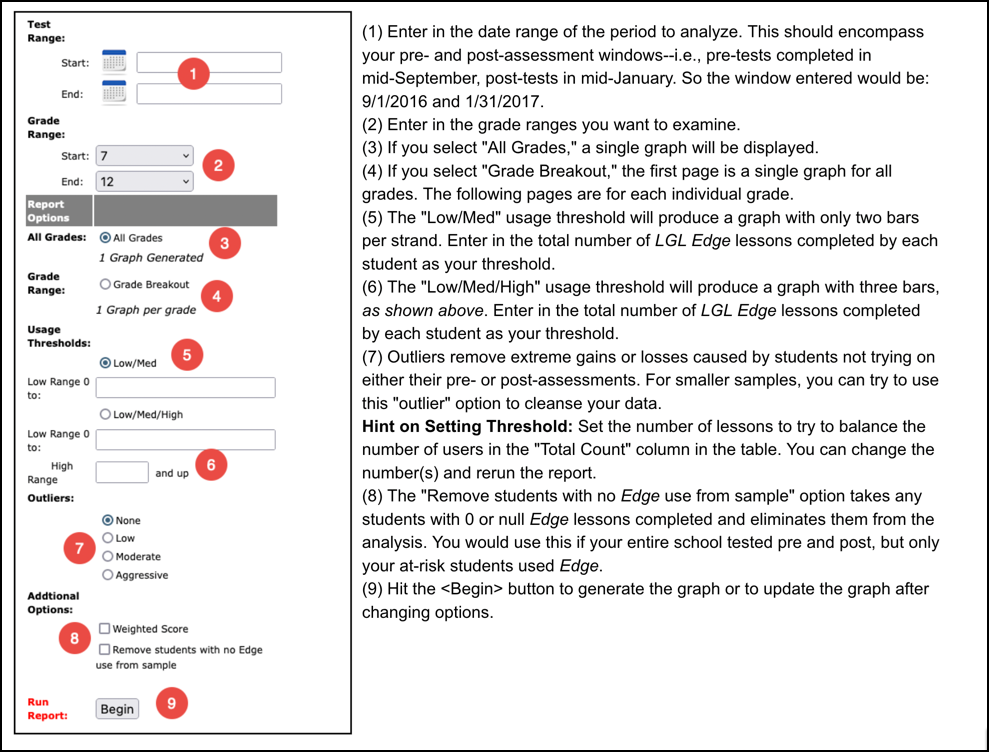
Step Four: Choose your parameters and then hit the <Begin> button.
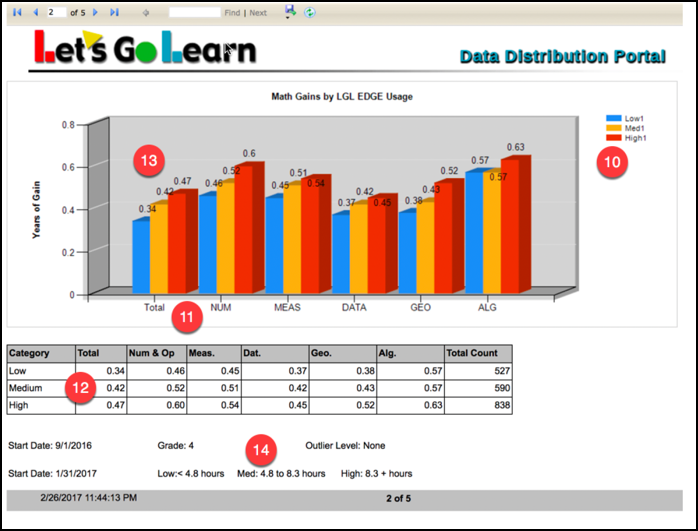
(10) “Low/Med/High” refers to the amount of LGL Edge usage based on thresholds in (5) or (6).
(11) The colored bars represent each usage group.
(12) This table shows the amount of gains in years by each usage group.
(13) The bars show the amount of gains in years by each usage group and by each sub-test.
(14) The number of lessons used in the thresholds is approximately converted to the number of hours on task. In this example, the low threshold is 20 lessons or less than 4.8 hours. The medium threshold above 20 and below 35 lessons or 4.8 to 8.3 hours. The high threshold is 35 or more lessons or 8.3 or more hours.

Step Five:  Save your final report.


Please click on the PDF below for cheatsheet.

Additional helpful links:

How to understand the Data Portal Demonstrated Gains Report Run on ADAM Assessments?

How do I understand the DOMA Pre-Algebra Demonstrated Gains report on the data portal?

Was this Article Helpful?
Please add a quick rating! It will help us improve articles for you!
Show fields from Show fields from Show fields from a related table
Report Name *
Description
Reports and Charts Panel
Each table has a panel listing its reports and charts, organized in groups.
Please wait while your new report is saved...
Field label
Column heading override
Justification
What does auto mean?
Fields in:

Fields to Extract:

Name for the new table:
Items in the new table are called:

When you bring additional fields into a conversion, Quickbase often finds inconsistencies. For example, say you're converting your Companies column into its own table. One company, Acme Corporation, has offices in New York, Dallas and Portland. So, when you add the City column to the conversion, Quickbase finds three different locations for Acme. A single value in the column you're converting can only match one value in any additional field. Quickbase needs you to clean up the extra cities before it can create your new table. To do so, you have one of two choices:

  • If you want to create three separate Acme records (Acme-New York, Acme-Dallas and Acme-Portland) click the Conform link at the top of the column.
  • If the dissimilar entries are mistakes (say Acme only has one office in New York and the other locations are data-entry errors) go back into your table and correct the inconsistencies—in this case, changing all locations to New York. Then try the conversion again.

Read more about converting a column into a table.

We're glad you're interested in doing more with Quickbase!

Now we need to make you official before you share apps or manage your account.

Verifying your email lets you share Quickbase with others in your company.

Your work email
Your company