Performance Bands: This report will provide sites with a view of their students broken into groups that correspond to �below,� �at,� and �above� grade level. Each group is a percentage of the total. This is ideal for examining overall performance either year over year OR within one year.
Please see below, under attachments, for instructions running report from a teacher account.
How to run the Performance Band Report � Admin Accounts
Log into the Data Portal (<Reporting> tab, then choose Data Portal)
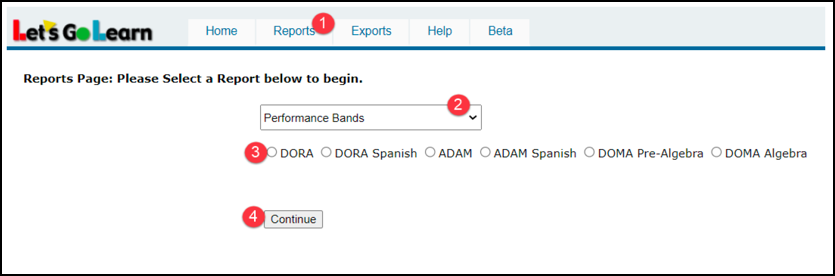
1. Click on Reports.
2. Click in the drop-down box and select Performance Bands.
3. Select the assessment for your report.
4. Click the Continue button.
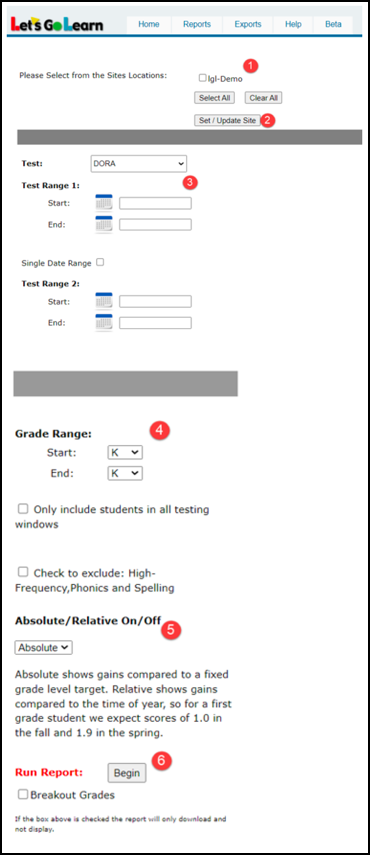
1. Select the site(s) you would like to include on your report.
2. Click on Set/Update Site.
3. Enter Test Range 1 start and end date as well as Test Range 2 start and end date. You may check the �Single Date Range� box if you would like to run the report for one testing window only.
4. Select your grade range.
5. Select Absolute or Relative.
6. Click on Begin to generate your report.
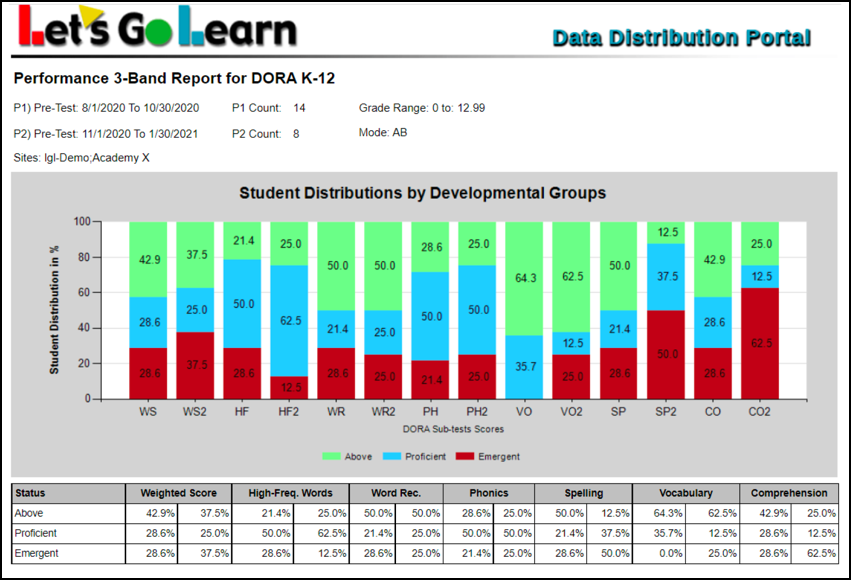
Below is an example report. It compares two testing windows � 08/01/2020 to 10/30/2020, then 11/01/2020 to 01/30/2021. There are two bars for each testing window.
Colors on the chart:
Green - % of students who are above level
Blue - % of students who are at proficient level
Red - % of students who are at emergent level
Video instructions for DORA Performance Band - Click Here
Video instructions for ADAM Performance Band - Click Here
See below under "Attachments" for downloadable/printable instructions for both Teacher and Admin accounts.
Other Related Knowledge Base Articles:
What are the grade level criteria for the ADAM performance band report?
What are the grade level criteria for the DORA performance band report?
What are the definitions of the Performance Bands used in the Data Portal and the below-grade definitions used in the assessments?


 Profile
 Sign up now
 Manage
  Sign out