From the Data Portal of the Admin(Principal) or Teacher account, you can export a report that shows per-student lesson and time aggregated by roster.
FROM TEACHER ACCOUNT
Edge Student Usage Report
(Report that shows per-student lesson and time aggregated by roster)
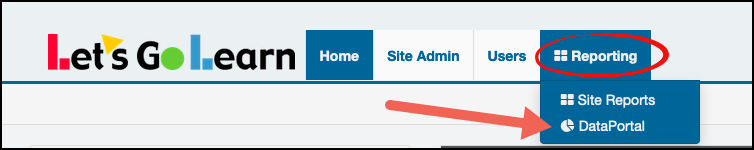
STEP 1 - Log into the Data Portal from the teacher account by clicking on the Reporting tab and selecting DataPortal. You can also access the Data Portal from the Scores & Reports tab.
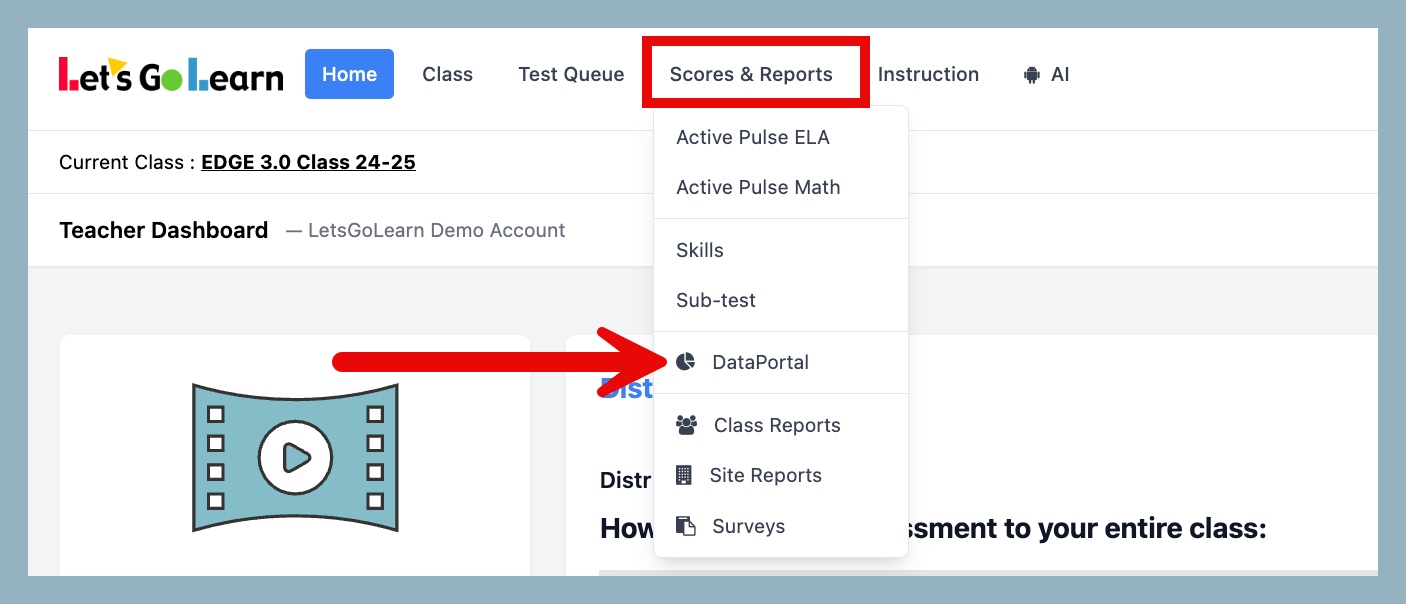
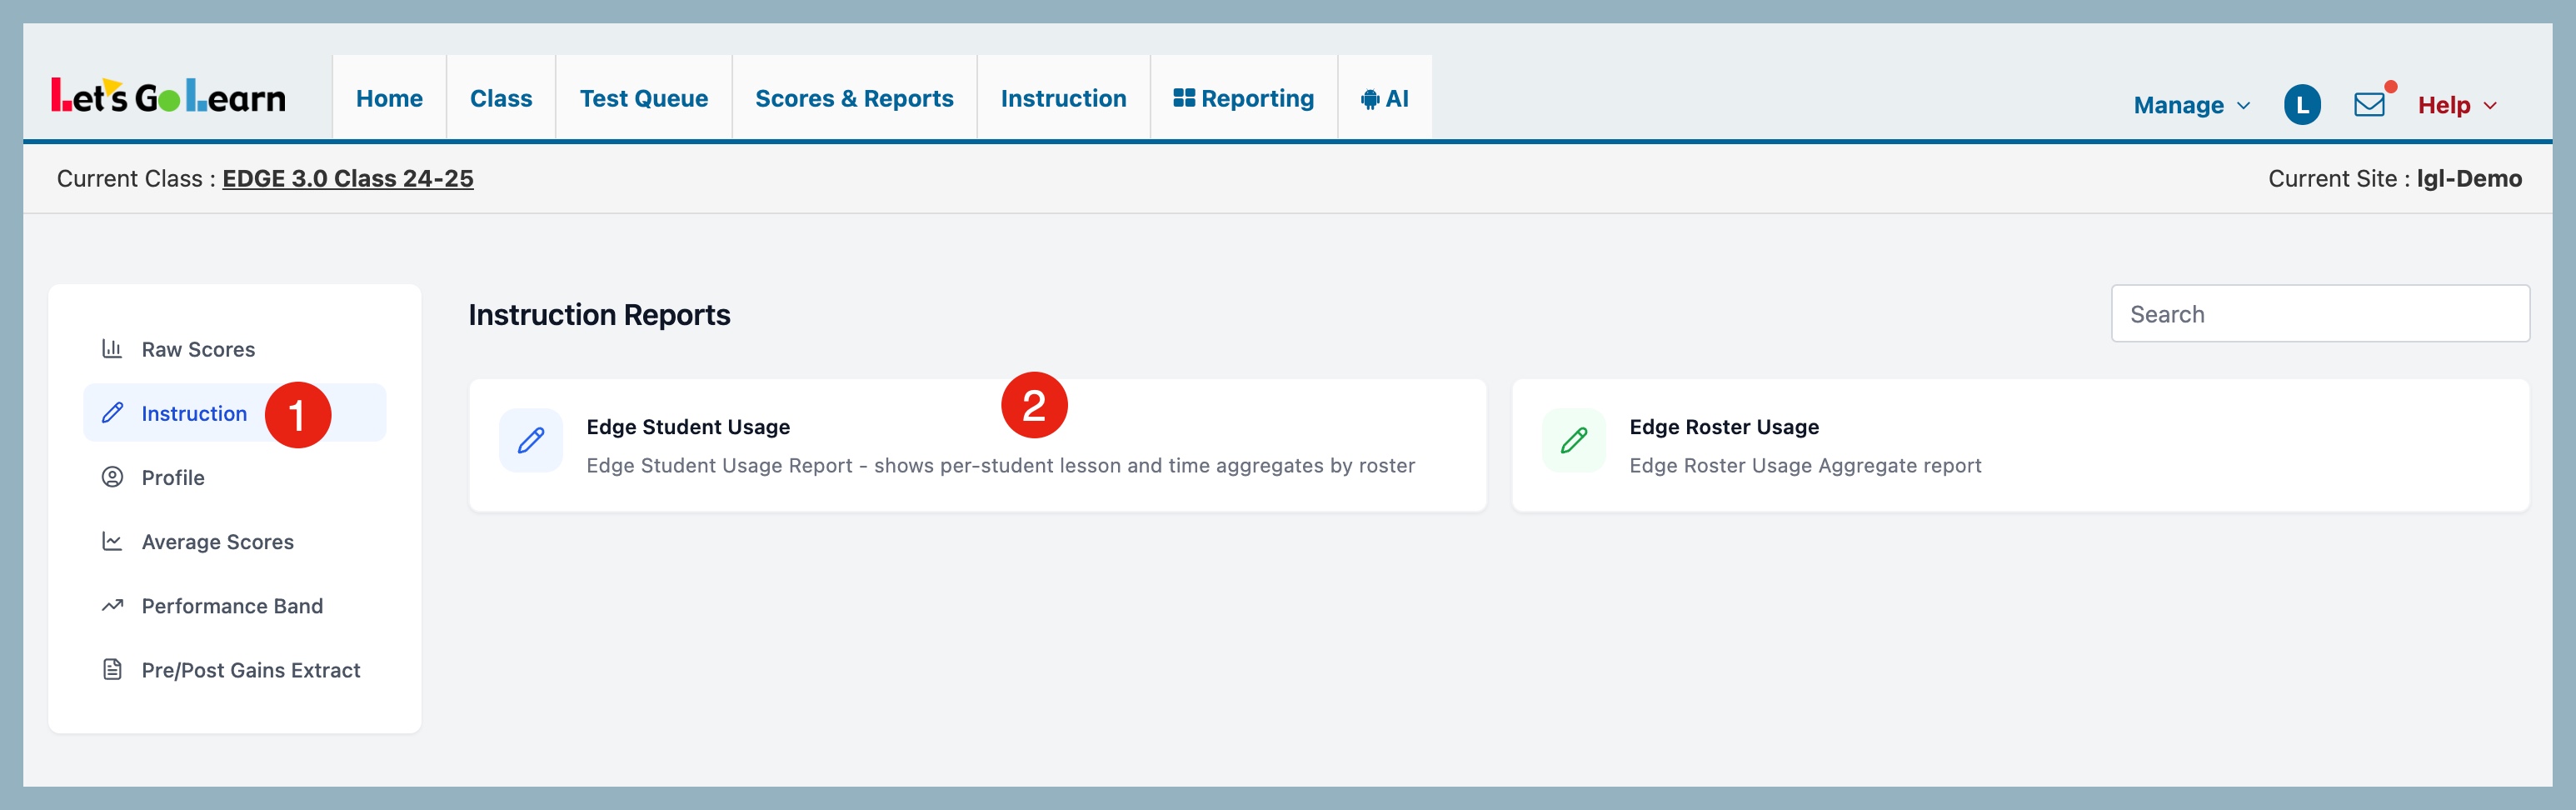
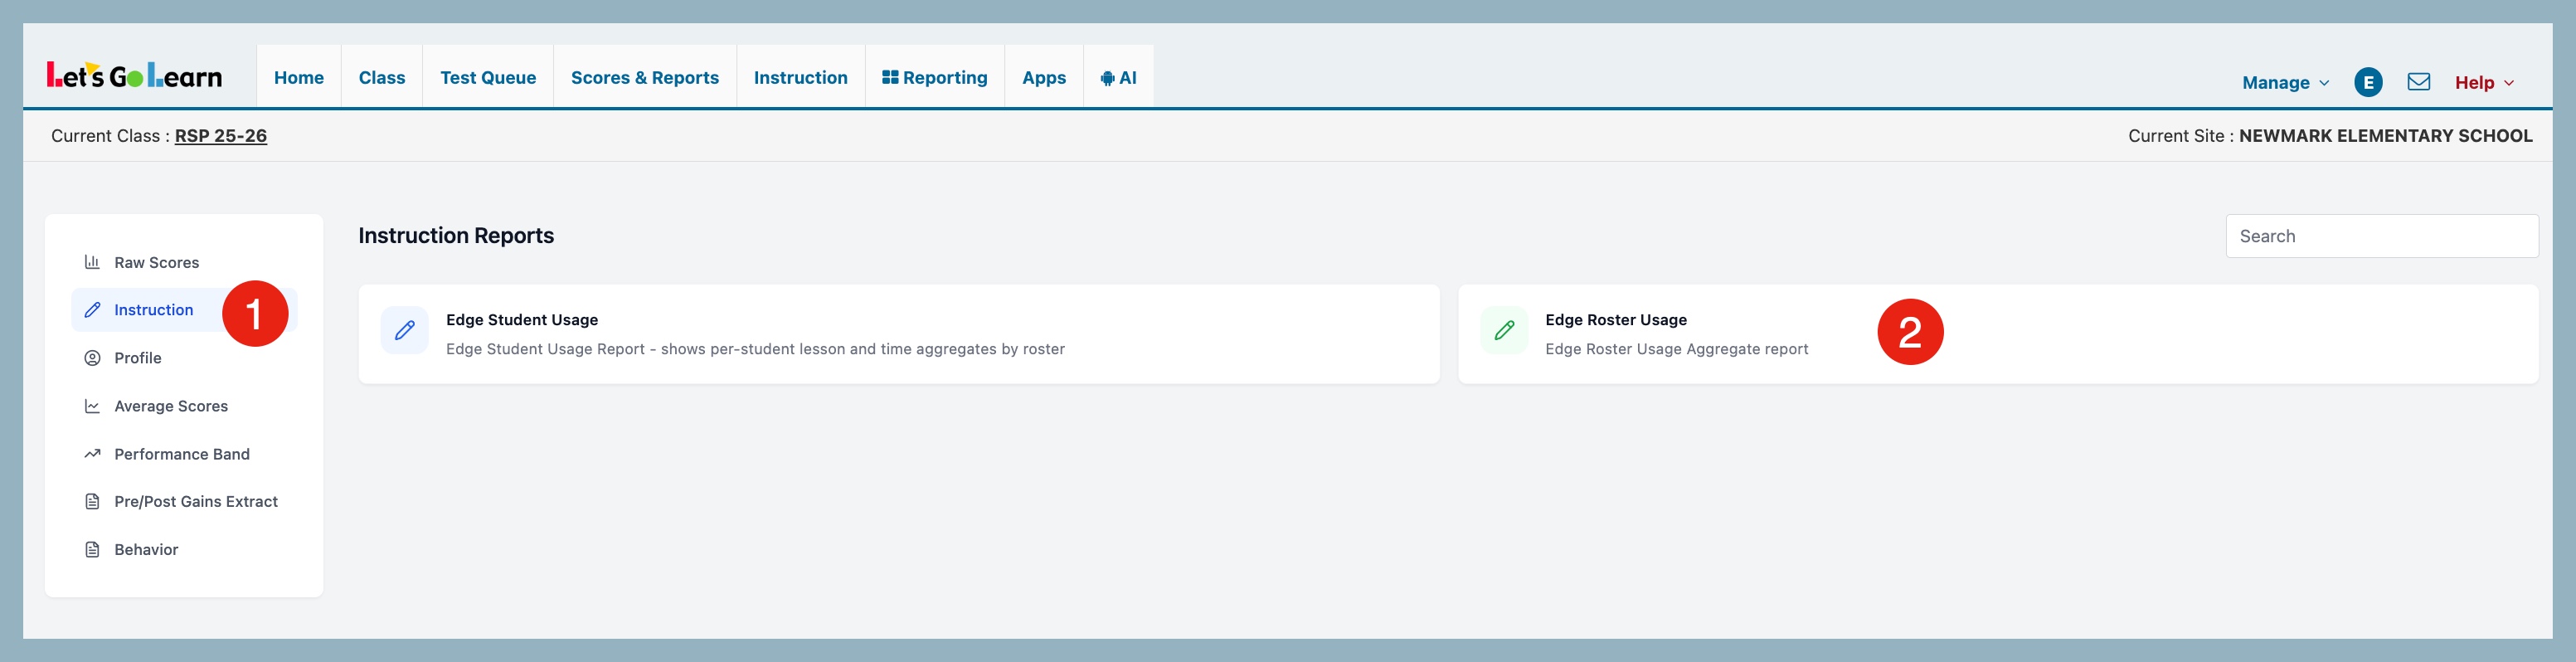
STEP 2 - On the Data Portal page, click Instruction and then select Edge Student Usage.
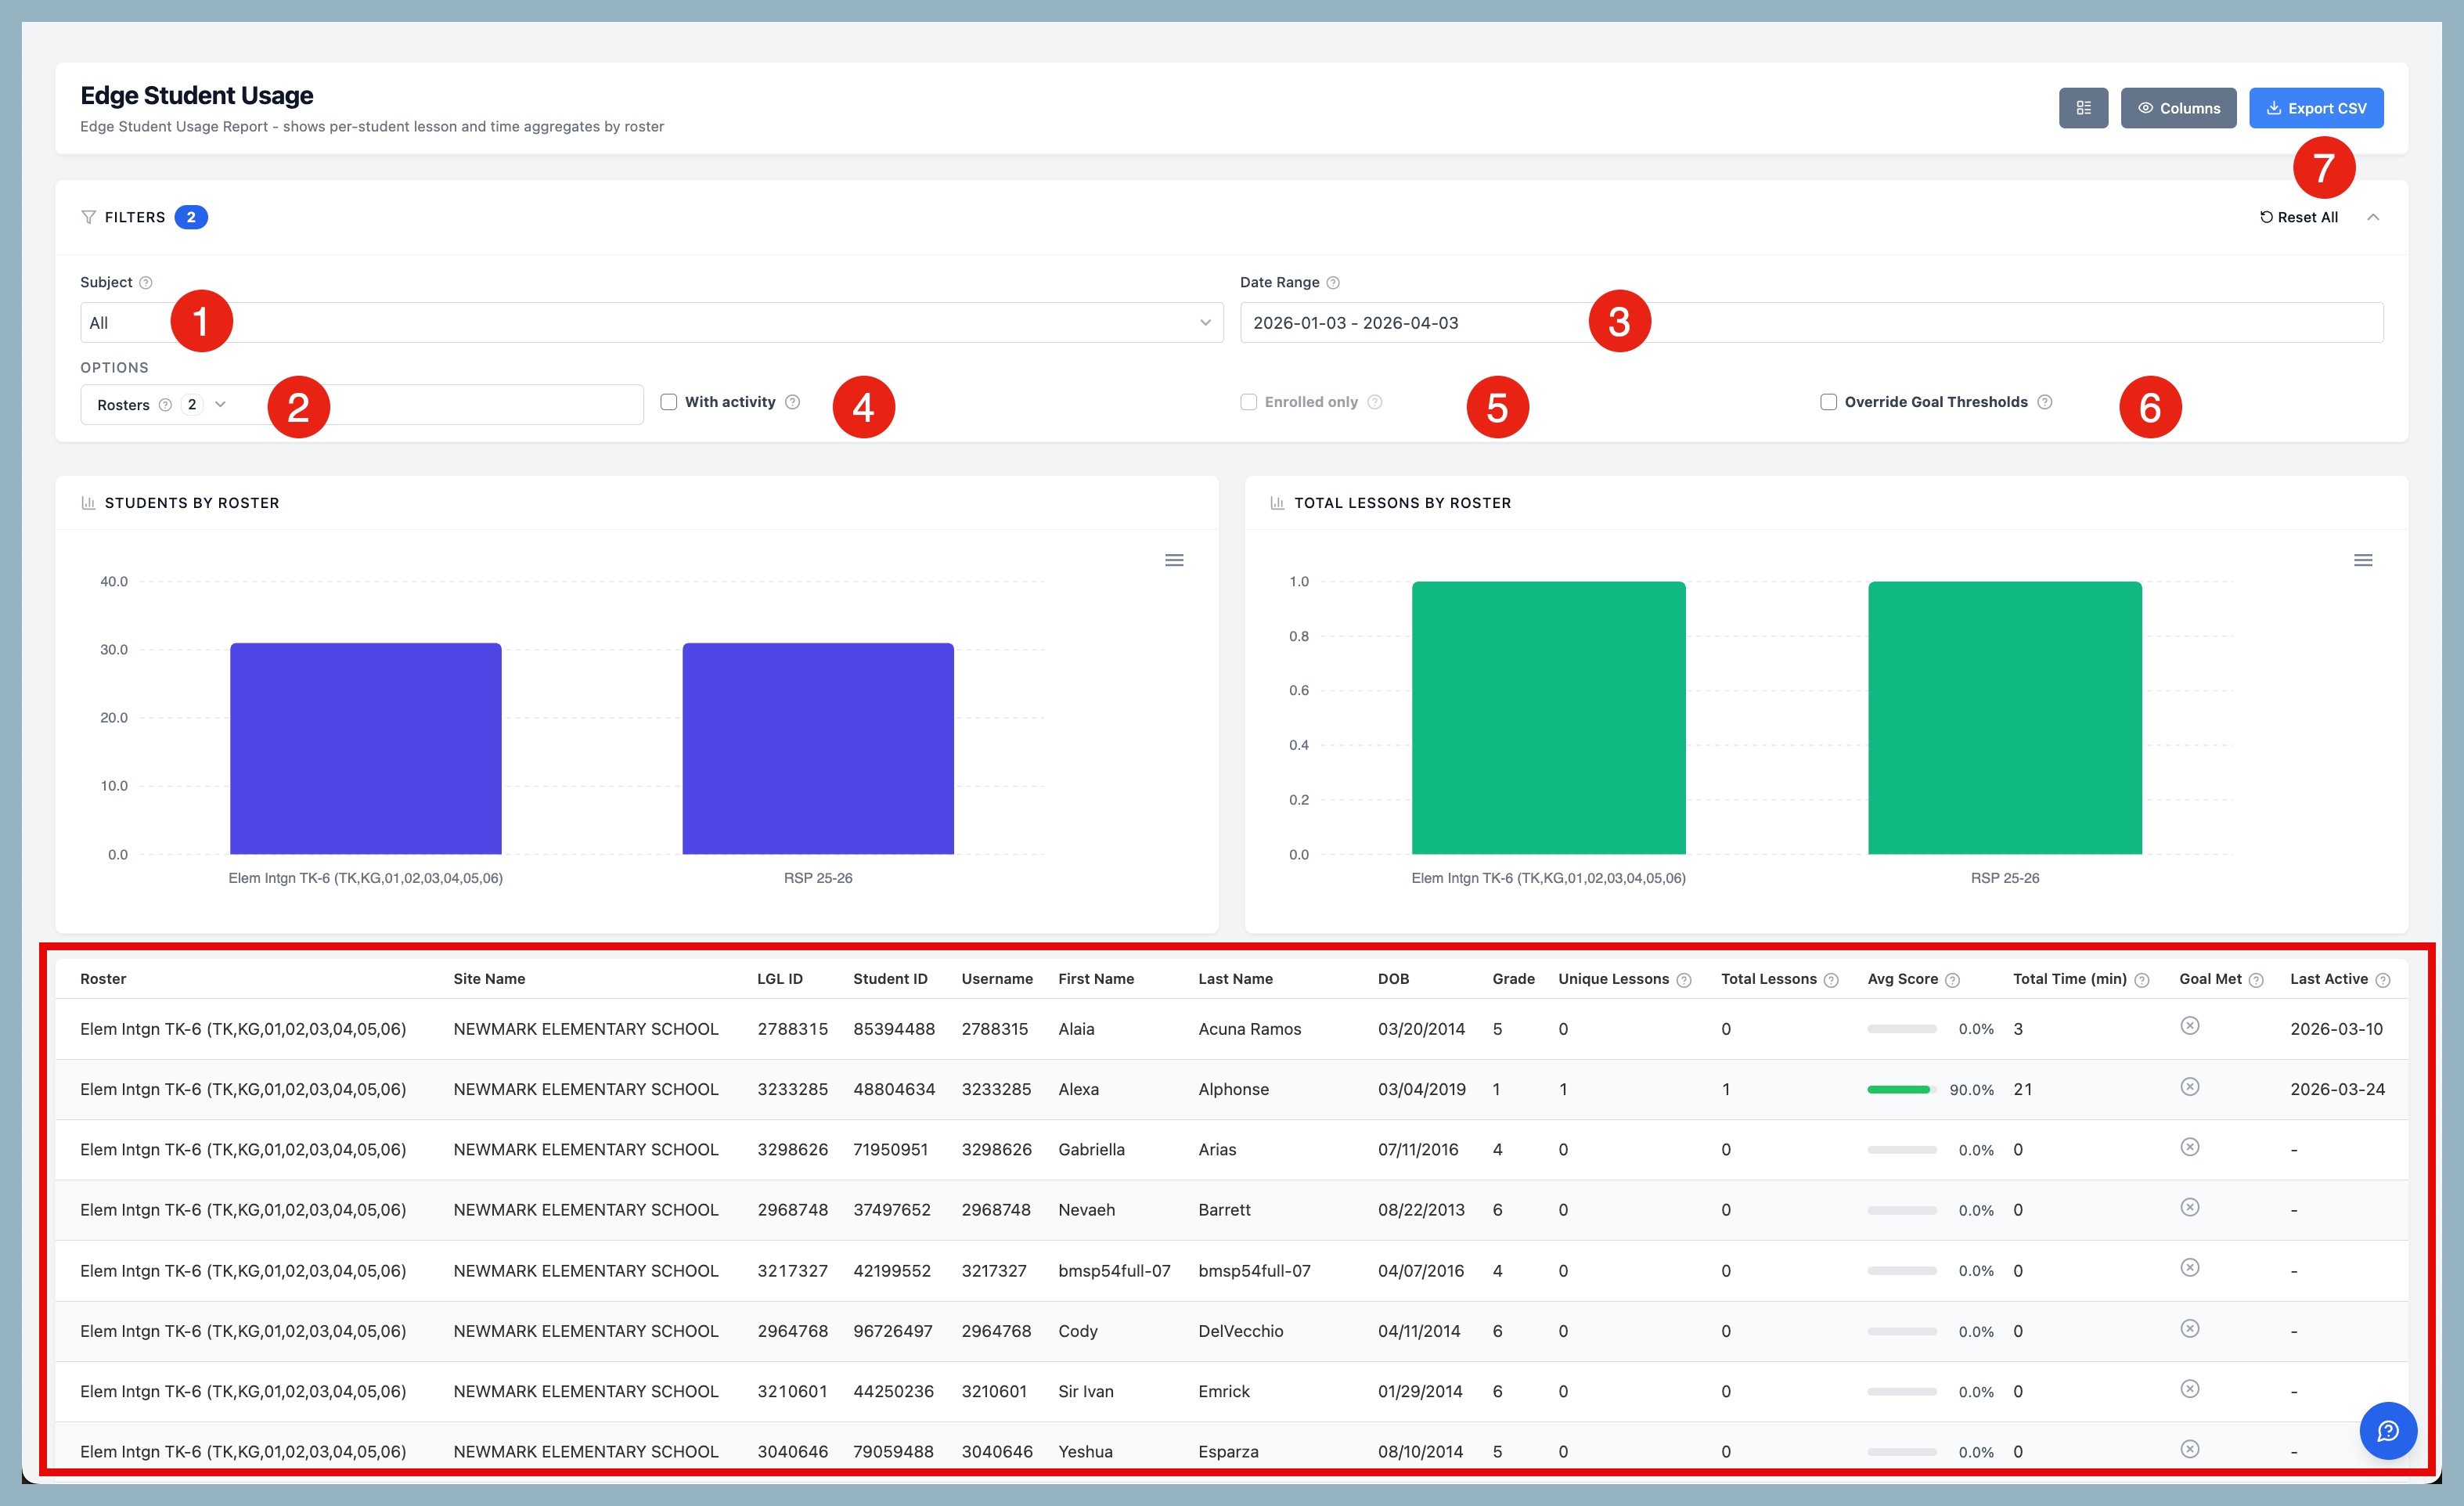
STEP 3 - On the Edge Student Usage Report page, select your report criteria.
- Subject - select Instruction subject
- Rosters - select Roster(s)
- Date Range - select date range for report
- With Activity - option to only show students who have completed at least one lesson
- Enrolled only - option to show only students who have an Edge assignment
- Override Goal Thresholds - Option to enable customized grade band thresholds used for the "Goal Met" calculation.
- Export CSV - download your results
Once filters are applied, your report will appear below.
Example Export
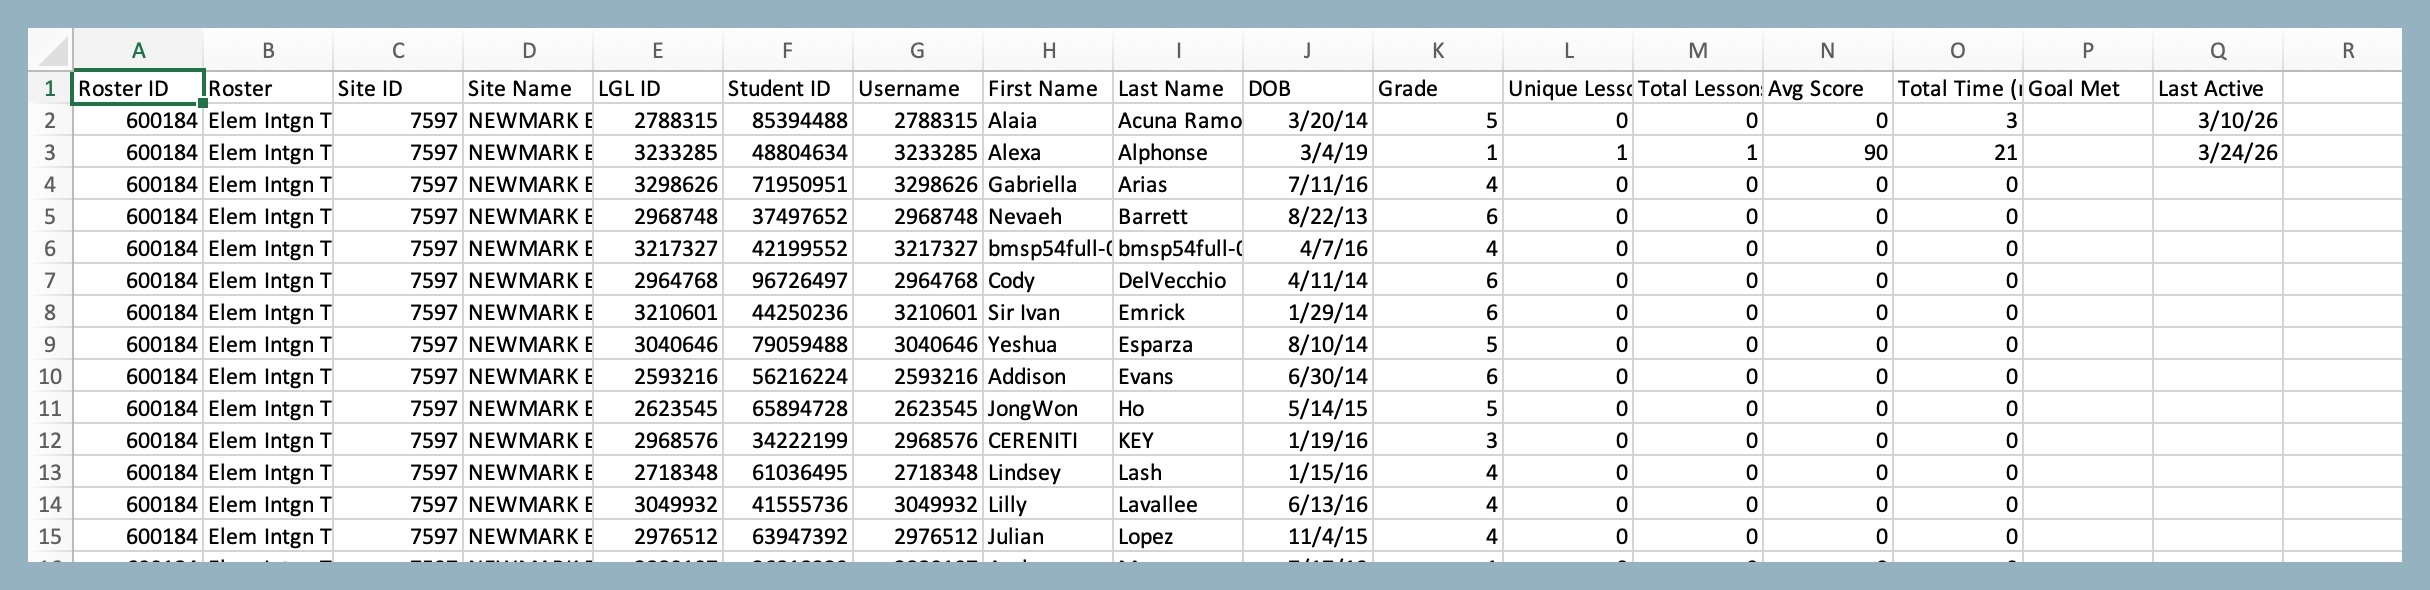
See below under "Attachments" for printable/downloadable PDF
Edge Roster Usage Report
(Edge Roster Usage Aggregate report)
STEP 1 - Log into the Data Portal from the teacher account by clicking on the Reporting tab and selecting DataPortal. You can also access the Data Portal from the Scores & Reports tab.
STEP 2 - On the Data Portal page, click on Instruction and select Edge Roster Usage.
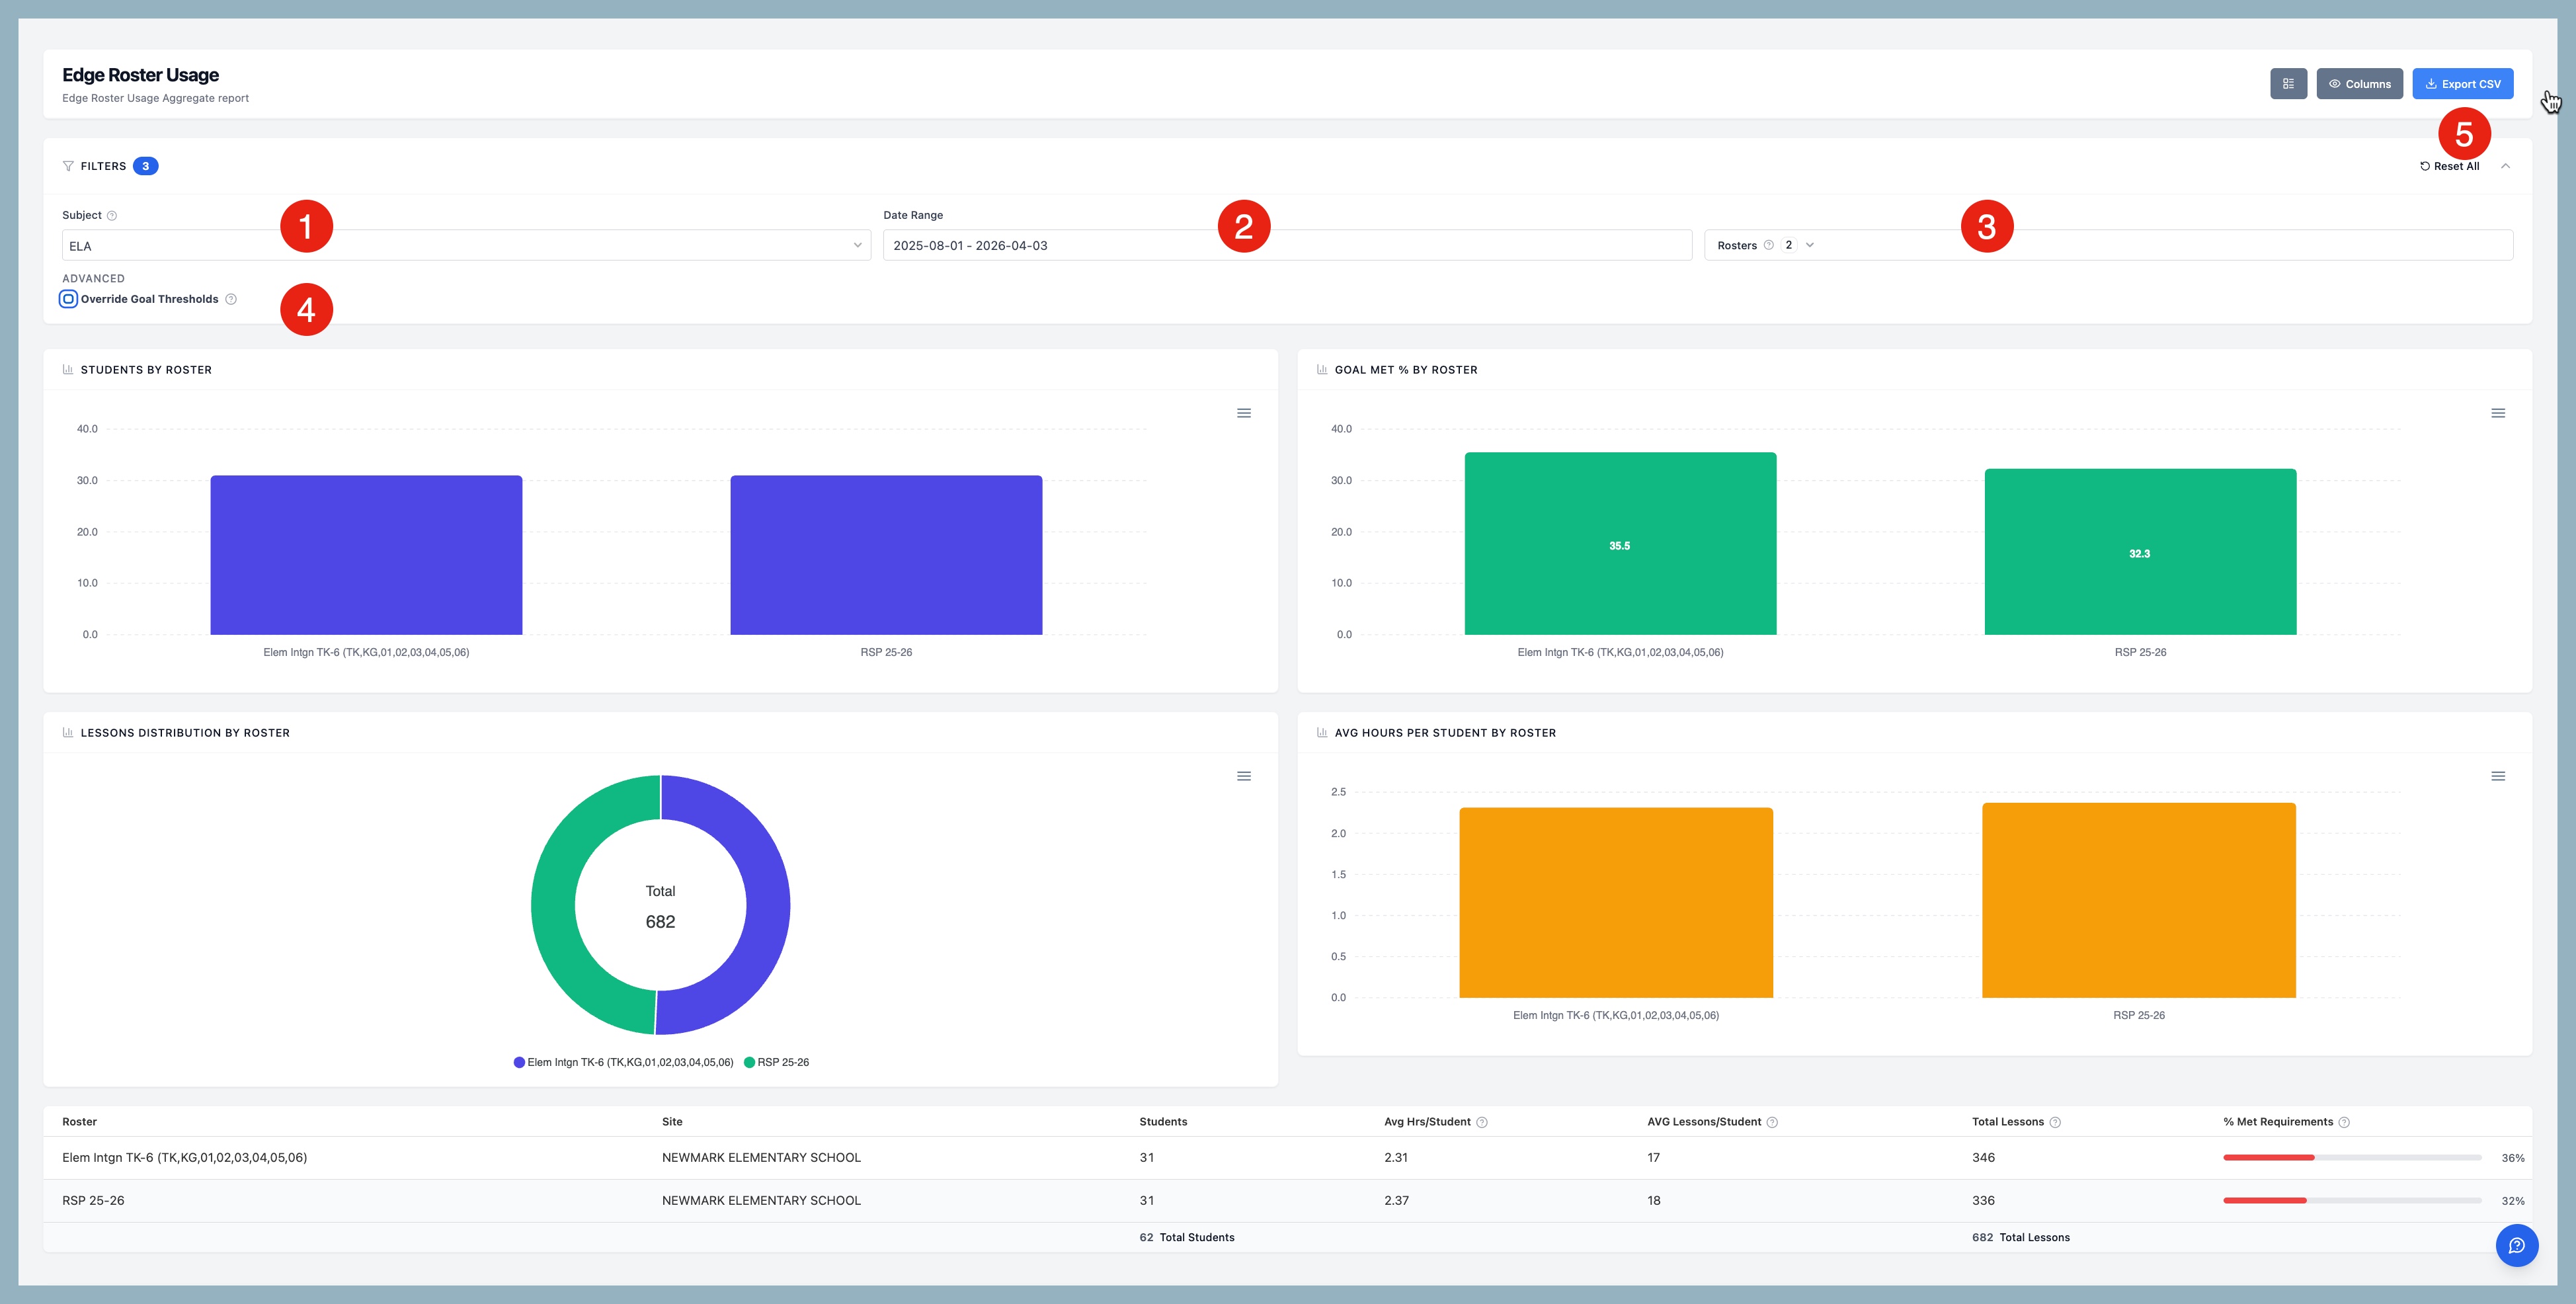
STEP 3 - On the Edge Roster Usage Report page, select your report criteria.
- Subject - select Instruction subject
- Date Range - select date range for report
- Rosters - select Roster(s)
- Override Goal Thresholds - Option to customize the grade band thresholds used for the "% Met Requirements" calculations.
- Export CSV - download your results
Once filters are applied, your data will appear below.
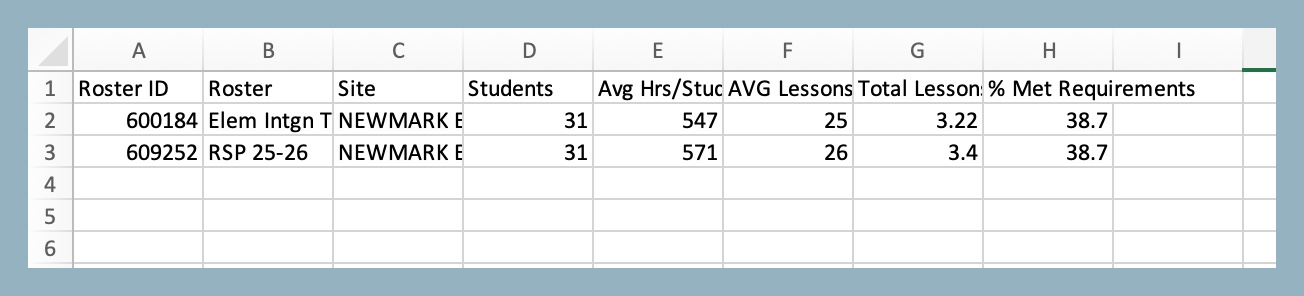
EXAMPLE EXPORT
Accessing Edge 3.0 Usage Report via the LGL Data Portal from a Principal/Admin account
Step One: Log into your Let's Go Learn account. Then go to the "Reporting" tab and select "DataPortal."
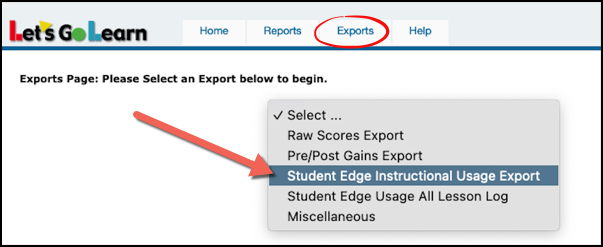
Step Two: Go to the "Exports" tab and select "Student Edge Instructional Usage Report."
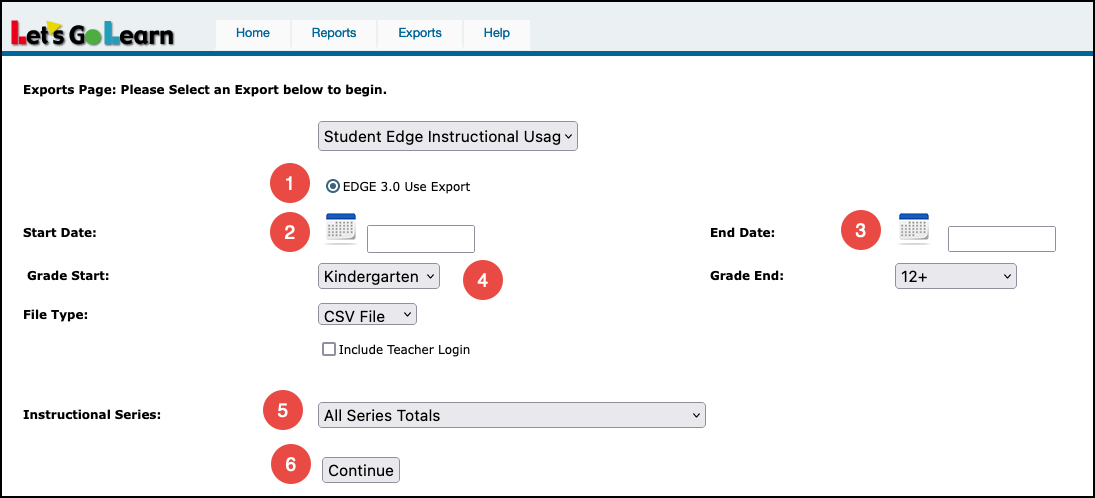
Step Three: Select your parameters:
(1) Choose one or more classes from your list of active classes.
(2) Select a "Start Date" for the instructional usage you want to examine.
(3) Select the "End Date" for the instructional usage. Note that the current day's data won't be updated until the late evening, so students' Edge use on the current day will appear the next morning.
(4) Select grade range.
(5) Select Instructional Series.
(6) Click Continue.
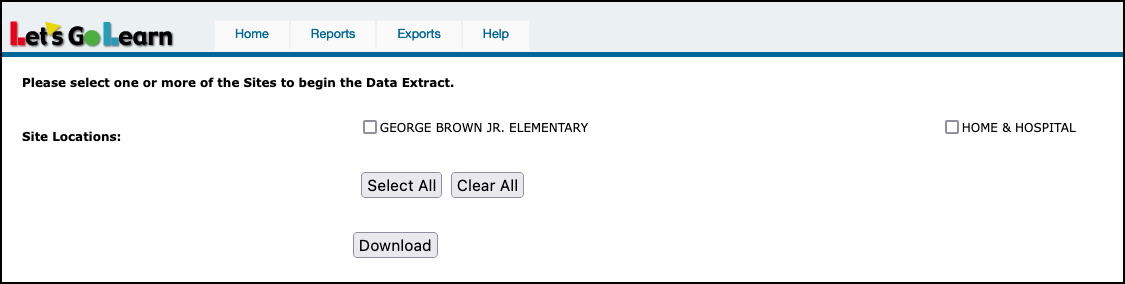
Step Four: Select Site Location(s) and then click Download.
Report Abbreviations
- SiteId: LGL site id number
- SiteName: name of school site
- LGL_ID: LetsGoLearn's ID number
- Student ID: school student ID number
- Student_Login: student username
- Fname: first name
- Lname: last name
- DOB: date of birth
- Grade: current grade
- Tot_Uniq_Les: total number of completed unique lessons
- Tot_Les: total number of lessons completed
- Tot_Time: total usage time by hours
- Math_Uniq_Les: total number of unique Math lessons
- Math_Tot_Les: total number of completed Math lessons
- Math_Ave_Score: average Math score
- Math_Time: total usage time for Math in hours
- Math_Last_Act: date of last Math activity
- ELA_Uniq_Les: total number of unique ELA lessons
- ELA_Tot_Les: total number of ELA lessons completed
- ELA_Ave_Score: average ELA score
- ELA_Time: total usage time for ELA in hours
- ELA_Last_Act: date of last ELA activity

Directly below this box is a downloadable PDF tip sheet which you may save for future use.


 Profile
 Sign up now
 Manage
  Sign out